Chapter 18 Cutting room floor
It’s worth remembering that most graphs end up on the proverbial cutting room floor. Some graph types in particular are truly hit or miss: parallel coordinate plots are at the top of the list in this category. I’m including some of the “misses” here so you’ll realize you’re not alone if you create a graph that does not show anything worthwhile.
18.1 Parallel coordinate plots
library(dplyr)
library(forcats)
library(ggplot2)
library(readr)
library(stringr)
library(tibble)
library(tidyr)

oedi_building <- read_csv("data/oedi_building.csv")
oedi_building |>
  filter(str_detect(in.building_type, "Office")) |>
  GGally::ggparcoord(columns = 1:4, groupColumn = 5,
                     alphaLines = .5, splineFactor = 10)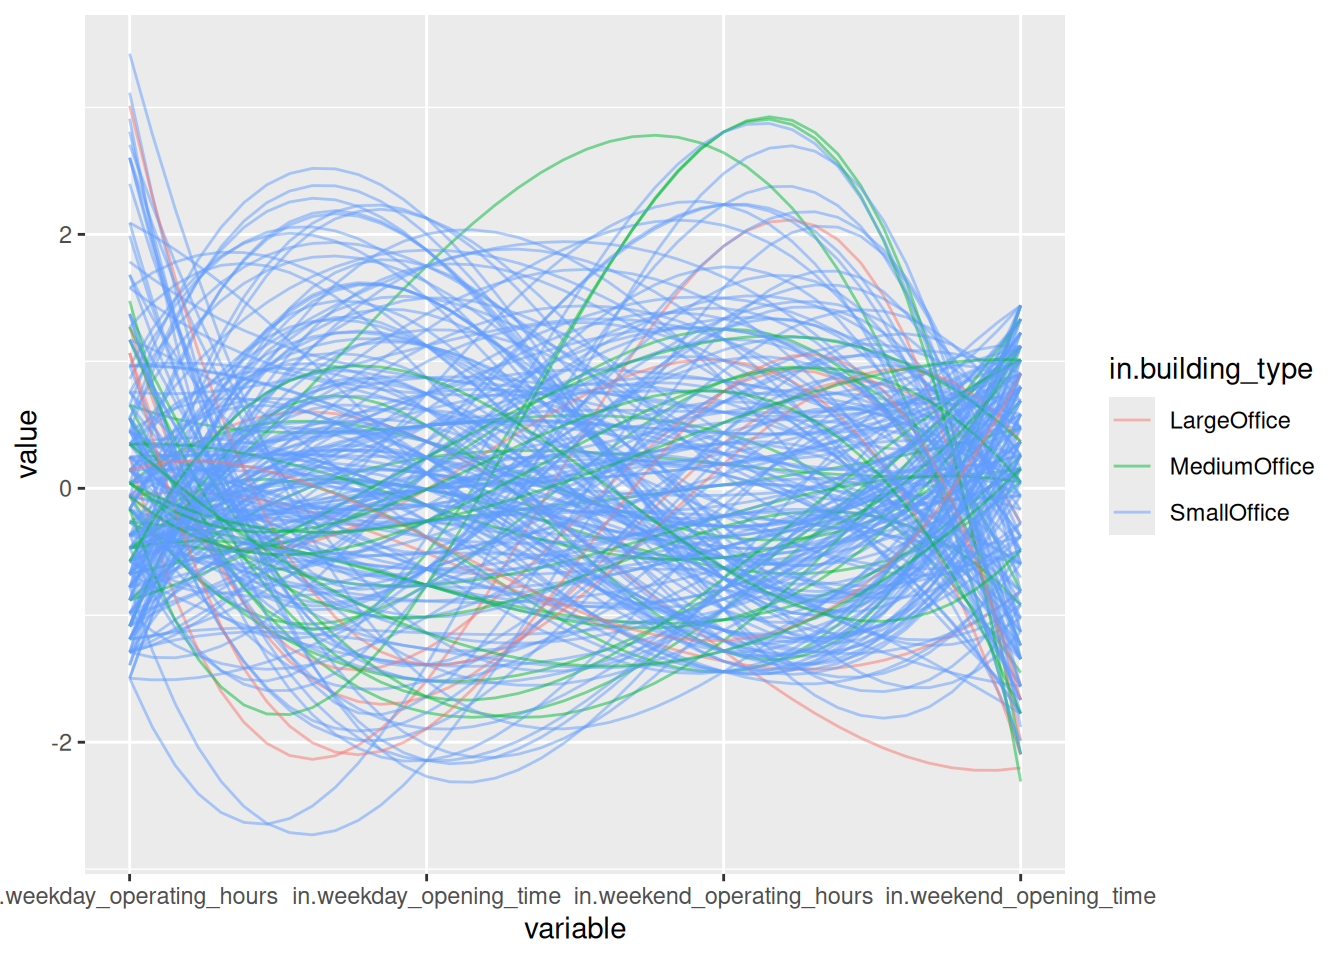
oedi_building |>
  select(c(starts_with("in.week")), in.heating_fuel) |>
  rownames_to_column("ID") |>
  pivot_longer(cols = starts_with("in.week"),
               names_to = "variable", values_to = "value") |>
  ggplot(aes(x = variable, y = value, group = ID, color = in.heating_fuel)) +
  geom_line(lwd = .1) +
  theme_bw() +
  coord_flip()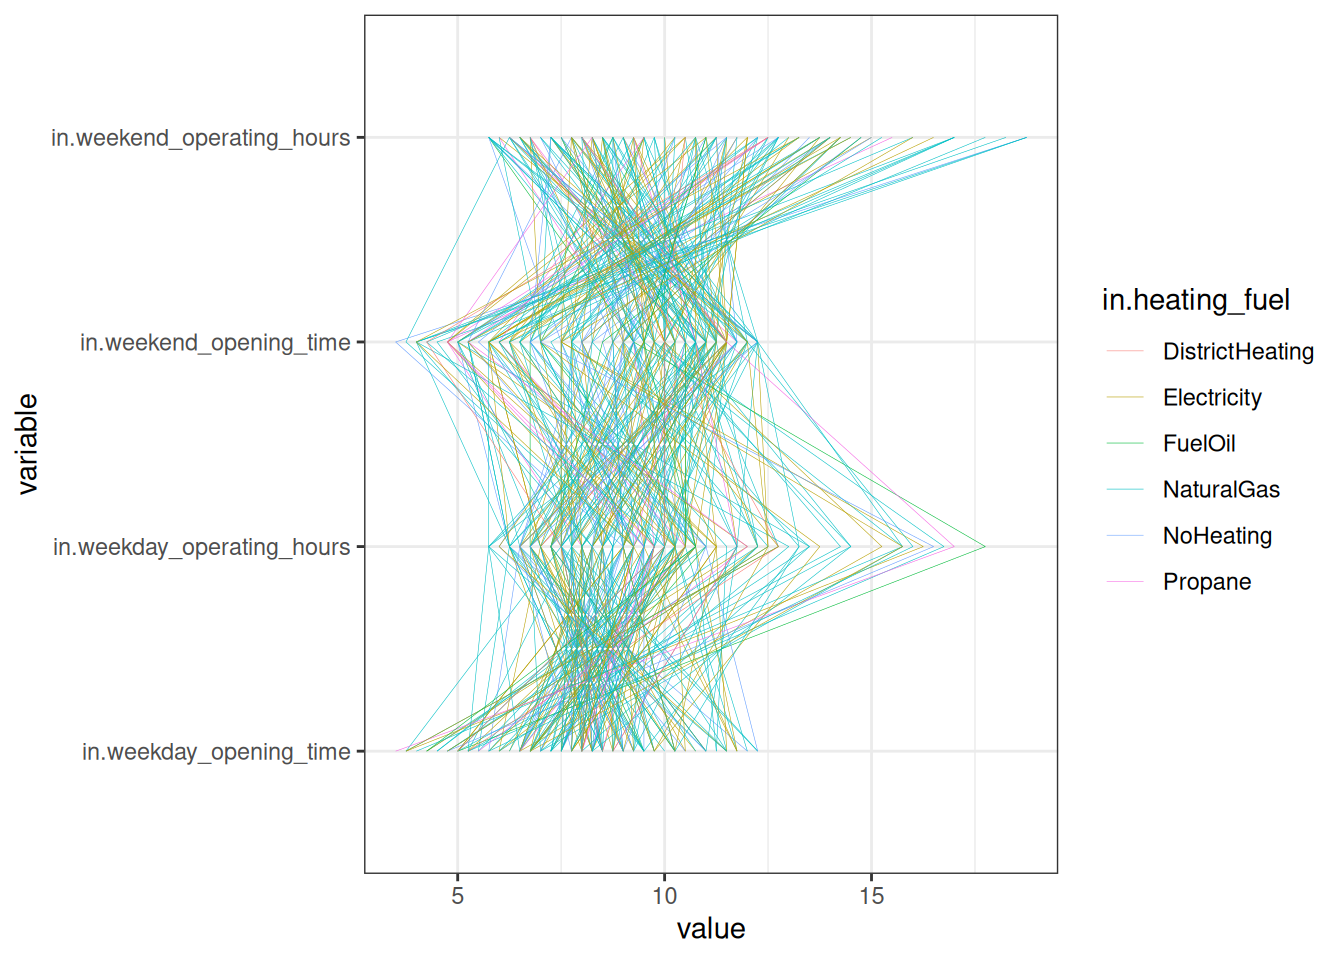
# https://collegescorecard.ed.gov/data
df <- read_csv("data/college_scorecard.csv")

df |>
  na.omit() |>
  mutate(COMP_ORIG_YR4_RT = as.numeric(COMP_ORIG_YR4_RT)) |>
  mutate(WOMENONLY = fct_recode(factor(WOMENONLY), `Women only` = "0", `Not women only` = "1")) |>
GGally::ggparcoord(columns = 1:4, alphaLines = .5,
                   scale = "globalminmax", groupColumn = 5) +
  theme_bw() +
  theme(legend.position = "bottom", legend.title = element_blank())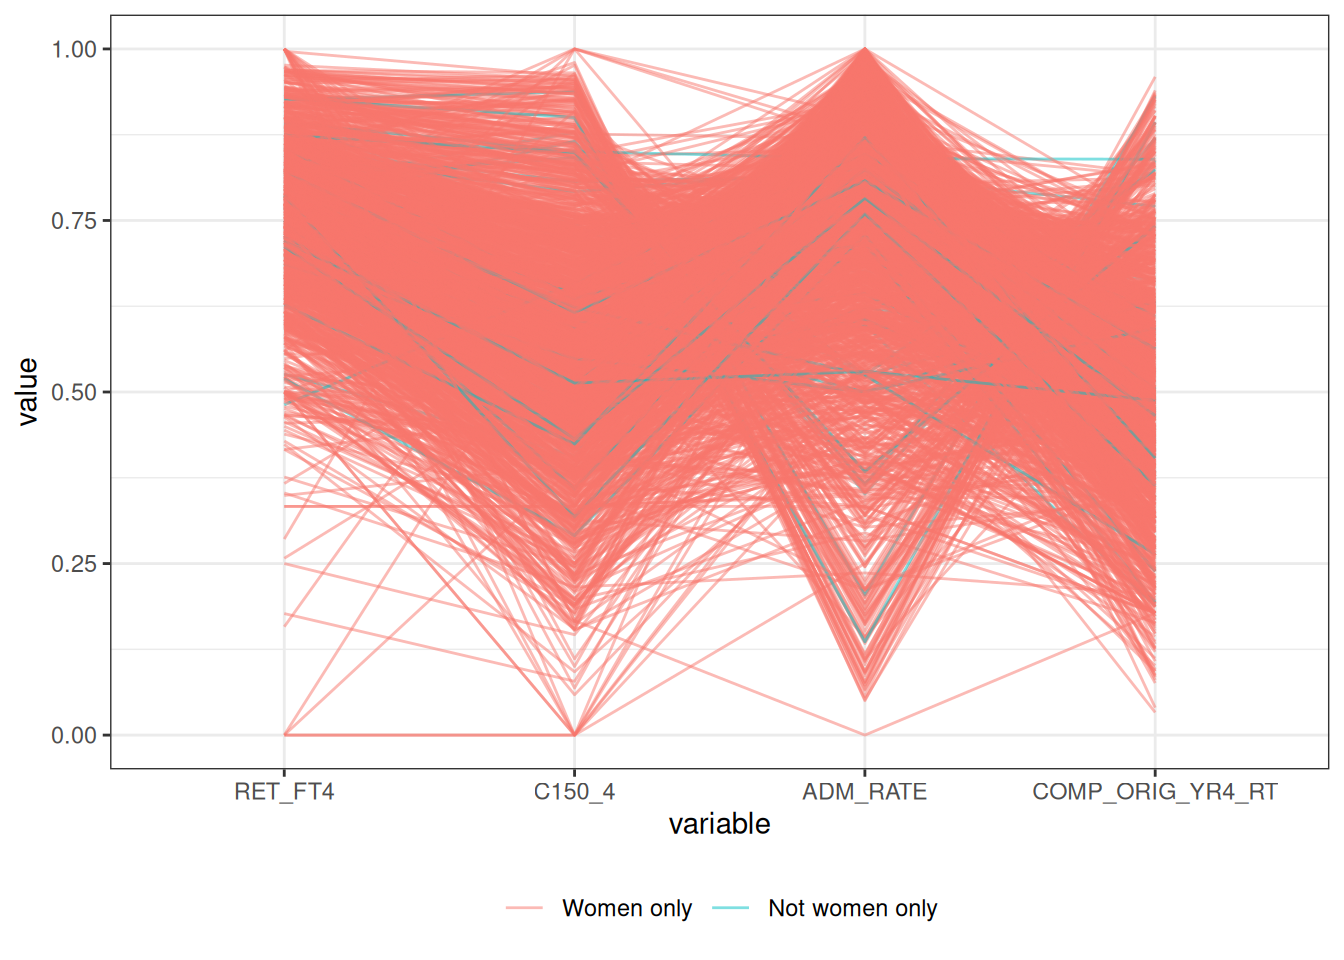
uk <- read_csv("data/uk_universities.csv",
               col_types = "ccdcddddddnncccccdddc")
uk |>
  GGally::ggparcoord(columns = c(5, 7, 9:12),
                     alphaLines = .5, groupColumn = 2) +
  coord_flip()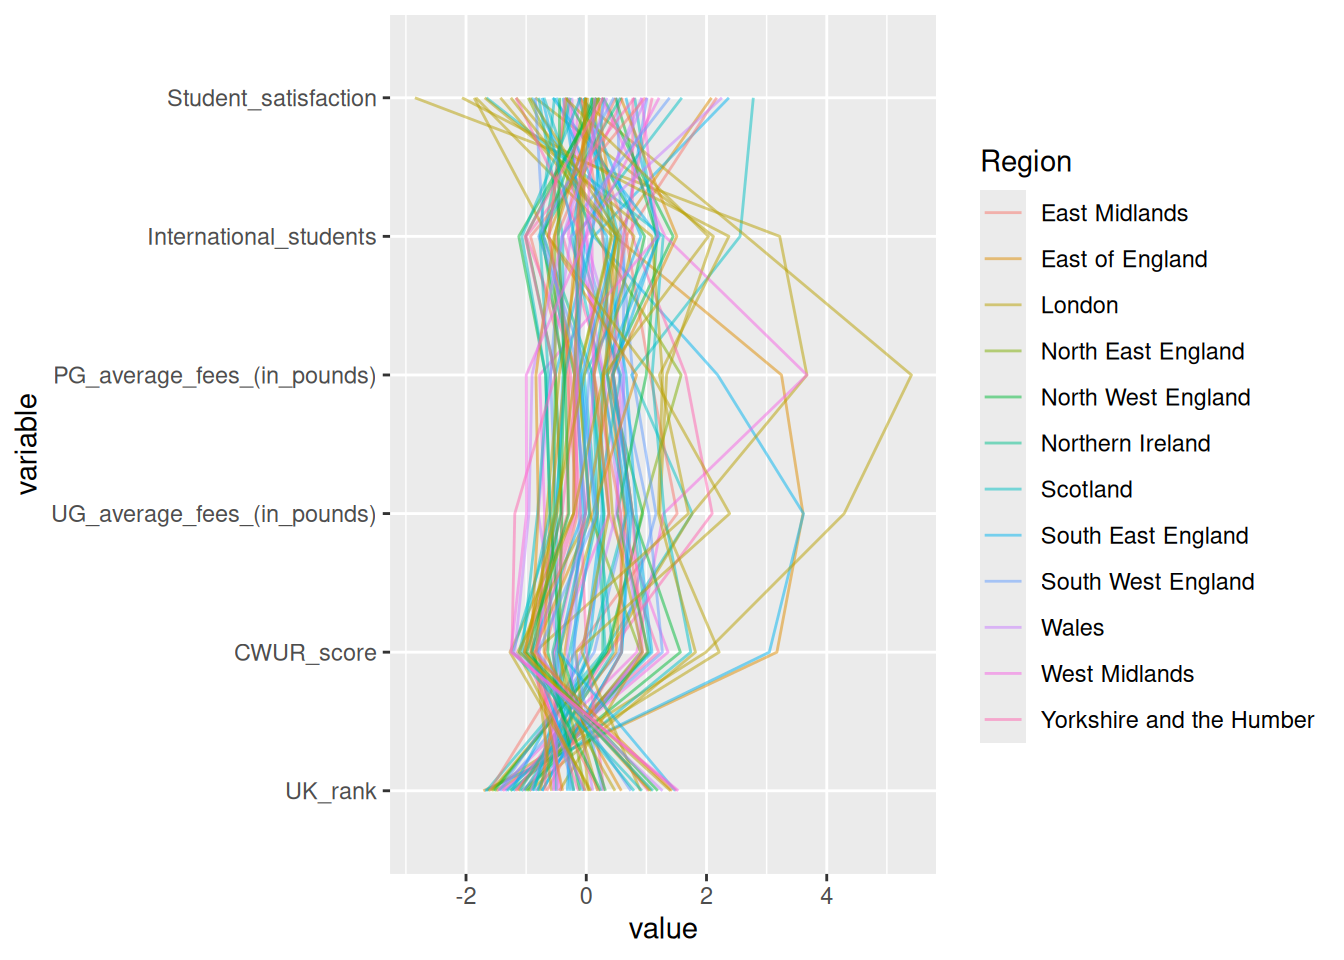
# https://www.strava.com/clubs/537620/leaderboard
run <- read_csv("data/leaderboard.csv", na = "--")

run$Longest <- parse_number(run$Longest)
run$Distance <- parse_number(run$Distance)
run$Pace <- parse_number(run$`Avg. Pace`)
run$Gain <- parse_number(run$`Elev. Gain`)

run |>
  filter(Distance < 1000, Rank <= 50) |>
  select(Athlete, Distance, Runs, Longest, Pace, Gain) |>
  parcoords::parcoords(rownames = F,
                       reorderable = TRUE,
brushMode = "1D-axes")library(parcoords)
uk |>
filter(str_detect(Region, "England")) |>
select(University_name, UK_rank, UGfees = `UG_average_fees_(in_pounds)`,
PGfees = `PG_average_fees_(in_pounds)`,
International_students,
Student_satisfaction,
COL = `Estimated_cost_of_living_per_year_(in_pounds)`,
Campus_setting) |>
parcoords(rownames = FALSE,
reorderable = TRUE,
brushMode = "1D-axes",
color = list(colorBy = "Campus_setting",
colorScale = "scaleOrdinal",
colorScheme = "schemeCategory10"),
withD3 = TRUE,
width = 770,
height = 600)